Services
Immersive Data Stories
When your audience is overwhelmed by data, an immersive story keeps them engaged — and moves them to act.
Immersive and interactive Data Stories bring your data to life, transforming numbers into captivating narratives that anyone can understand and enjoy. Instead of overwhelming your audience with complex figures, these visual experiences guide them smoothly through the story behind the data—using engaging visuals, playful interactivity, and relatable storytelling techniques. Each story is carefully designed with a thoughtful narrative flow, making your message clear, memorable, and impactful. By inviting your audience to actively explore and connect with the data, these stories inspire curiosity, spark meaningful conversations, and drive informed actions. Let’s turn your data into an engaging journey people actually want to explore!


Data Visualization
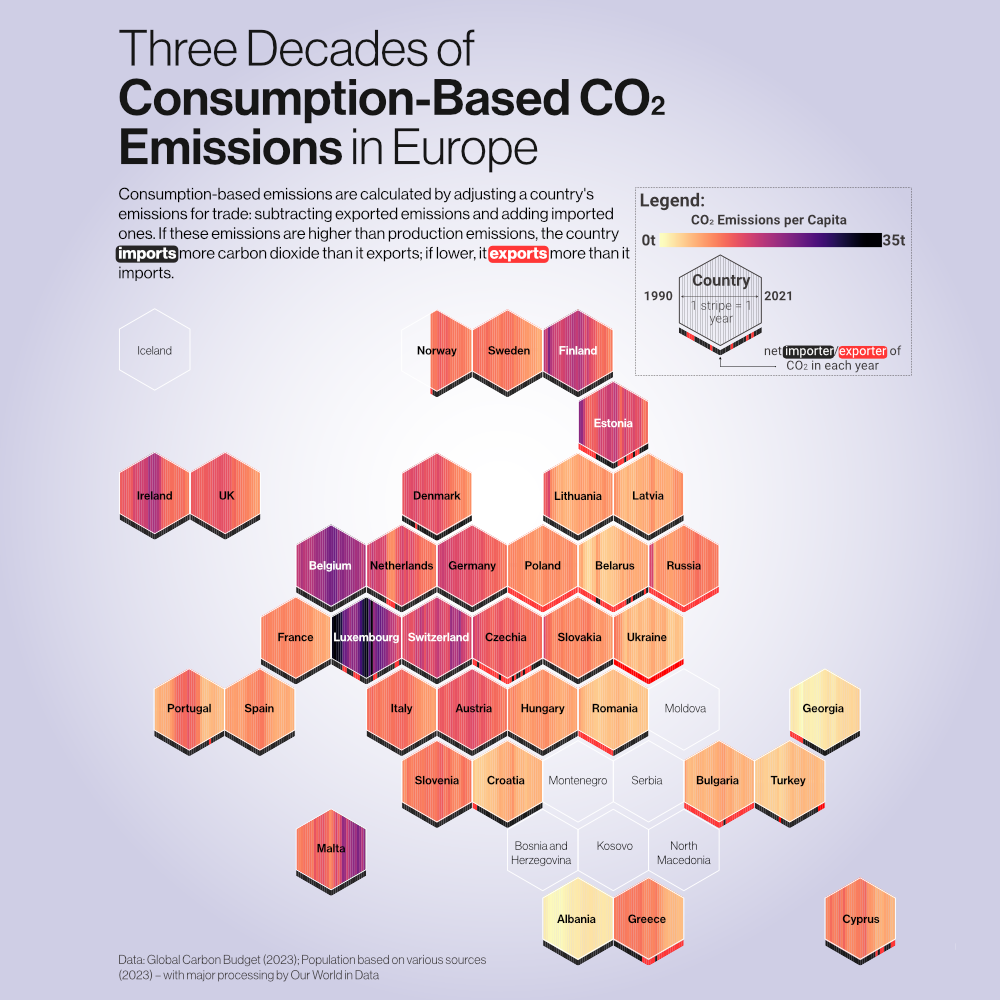
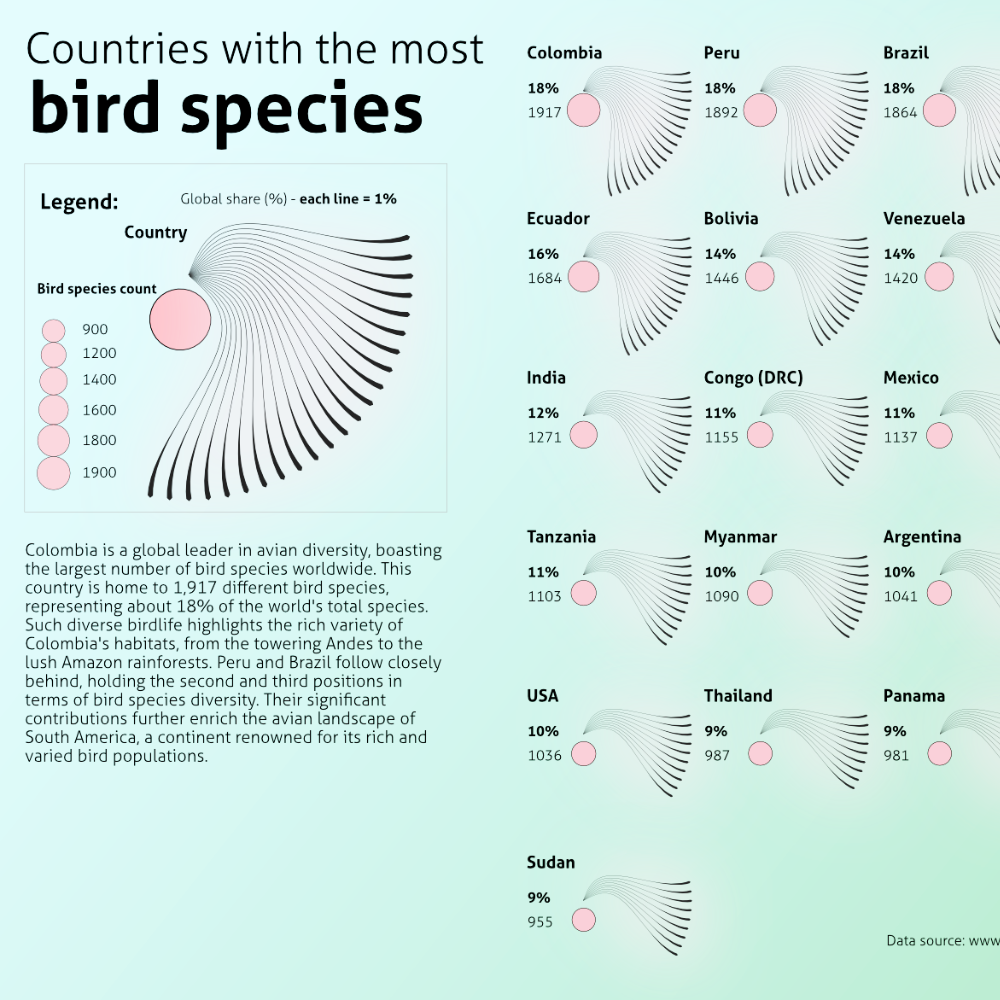
When data is hard to read, insights stay buried. Clear visuals make sure your message lands instantly and sticks.
Bring your numbers to life with clear, engaging visuals—like charts, maps, and custom dashboards—designed to make information easy to grasp and act on. These visuals don’t just look good; they help your audience understand the story behind the data instantly, so they can make smarter, faster decisions with confidence.


Report Design
When data is hard to read, insights stay buried. Clear visuals make sure your message lands instantly and sticks.
Bring your numbers to life with clear, engaging visuals—like charts, maps, and custom dashboards—designed to make information easy to grasp and act on. These visuals don’t just look good; they help your audience understand the story behind the data instantly, so they can make smarter, faster decisions with confidence.
Data Strategy & Team Training
Great visual design starts long before the first chart.
We support you in making sense of your data: cleaning, organizing, and preparing it for meaningful use. From taxonomies and tagging systems to data models ready for visualization, we help build a solid foundation. Alongside this, we offer practical training to strengthen your team’s visual communication skills, through workshops on chart design, storytelling, dashboards, infographics, and presentations. It’s about building clarity from the ground up and empowering your team to communicate with confidence.